The new site looks great!
P.S. Did not know that Avogadro2 is capable of making critical point pictures. How to do that?

I think this refers to the point group of the molecule, such as C2v for the water molecule.
This is a different kind of analysis. Avogadro 2 does have full point group symmetry analysis (e.g. New symmetry features in 1.94)
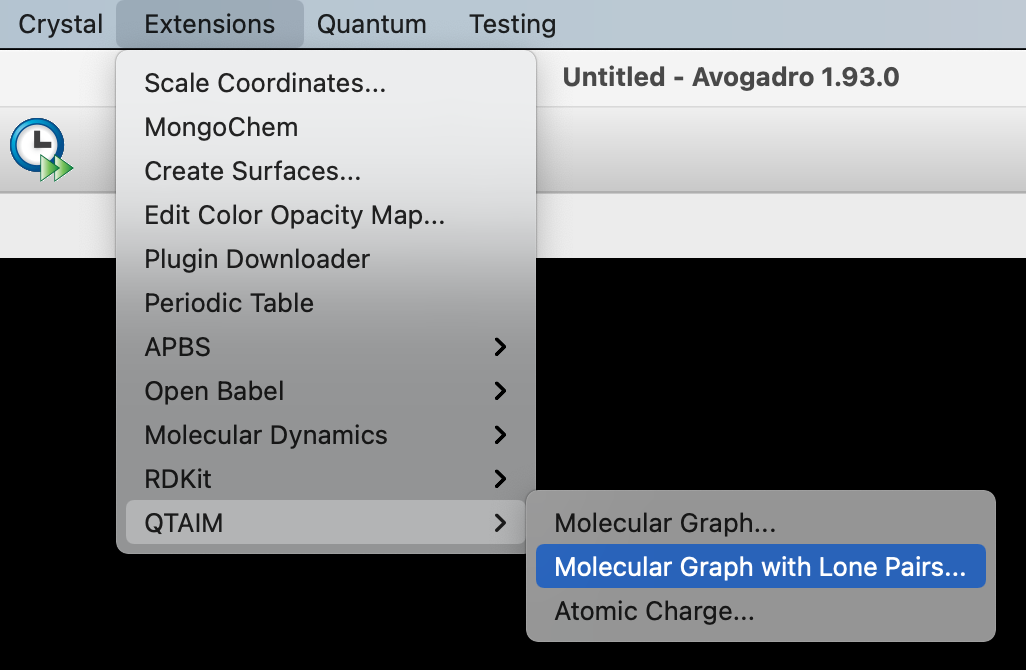
QTAIM is Bader’s Atoms-In-Molecules analysis. It looks at the quantum chemical electron density to find bonding interactions, lone pairs, etc.
The code is pretty much identical to the v1 version: Using Atoms-In-Molecules (Bader) Analysis - QTAIM and WFN - Avogadro
Thank you, this is cool. I tried to do it on one of my molecules and got a nice picture of critical points and paths, connecting them:

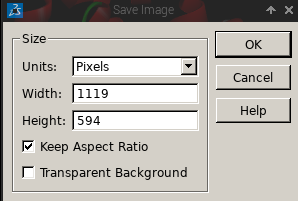
Unfortunately, graphics export options are limited to a .png with a pre-defined resolution. And I did not find any settings for points/paths depiction, too.
Maybe it is due to the usage of Wine version instead of native Linux one. I haven’t been able to install it due to some Qt issues.
UPD. The program got stuck after atomic basins analysis when I tried to calculate QTAIM charges.
What exactly are you looking for?
A possibility to change resolution is critical if you are making graphics for a paper. I attached a screenshot of the corresponding window from Discovery Studio Visualizer
BTW, if you need help in testing new releases – I would be glad to. Unfortunately, I do not know C++, but at least I can help in testing)