I am not sure if this is an issue with my software or me. I am trying to visualize a Raman spectrum of benzene. I ran a freq calculation in Gaussian using the freq=Raman keyword, but when I open the output file in Avogadro I only have the option to see the infrared spectrum. I’m wondering if I am not giving Avogadro the correct info to generate a Raman spectrum, or if there’s some sort of issue with my software.
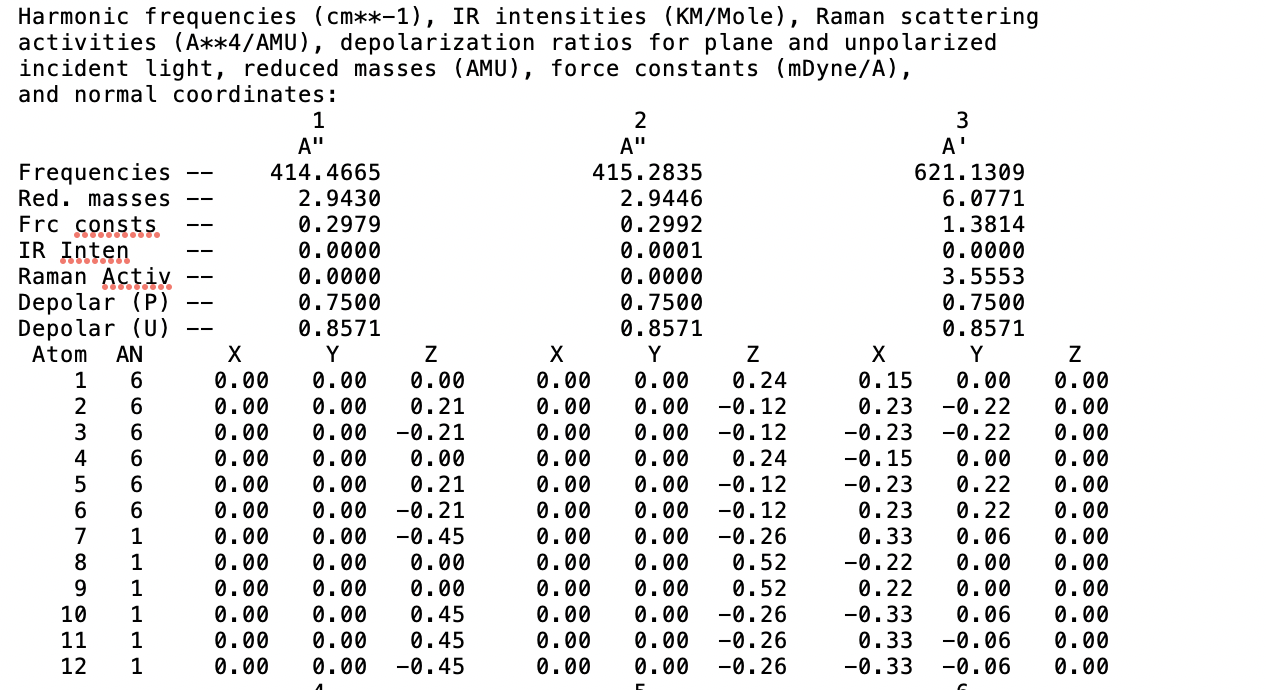
Here is a screenshot of the output for the first couple of atoms. It appears Raman-related information was generated, but perhaps not the correct one?
It’s been a while since I used Avo1.2, but it’s entirely possible it only plots the IR information.
If you share the file, I can make sure it works in Avo2.
It looks like from this page that it’s already feasible with Avo1.2, Infrared and Raman — ORCA tutorials 4.2 documentation
That’s what makes me wondering if I am just not giving it the right input.
No, it’s more a question of the Gaussian reader. The Orca developers contributed that code (many thanks) - so obviously, when they show it doing Raman, it works.
At the moment, I don’t remember if the Gaussian IO code reads the Raman intensities…
You are right, after much searching I found that Gaussian spits out Raman activities not intensities and Avogadro isn’t able to make the conversion. GaussSum and apparently Molden are able to, if anyone else is looking for a free option. Hopefully Avogadro will include that feature in the next update!
1 Like