I would like to know which is the equation implemented in Avogadro to smooth the absorption spectrum using the gaussian width. I would appreciate if someone can tell me where I can find this information.
I plot the Absorption Spectrum calculated using ORCA 5.0.4 program. I set the gaussian width at the advanced options. The plot looks really fine, but I was not able to reproduce it doing by hand, such as python. I guess I am not using the same equation as implemented in Avogadro.
I’m guessing you are asking about Avogadro 1.2?
The Gaussian broadening is applied in energy (eV) and then the resulting spectra is converted to wavelengths.
But perhaps I’m misunderstanding. Can you upload an image of the difference you’re seeing?
Hi
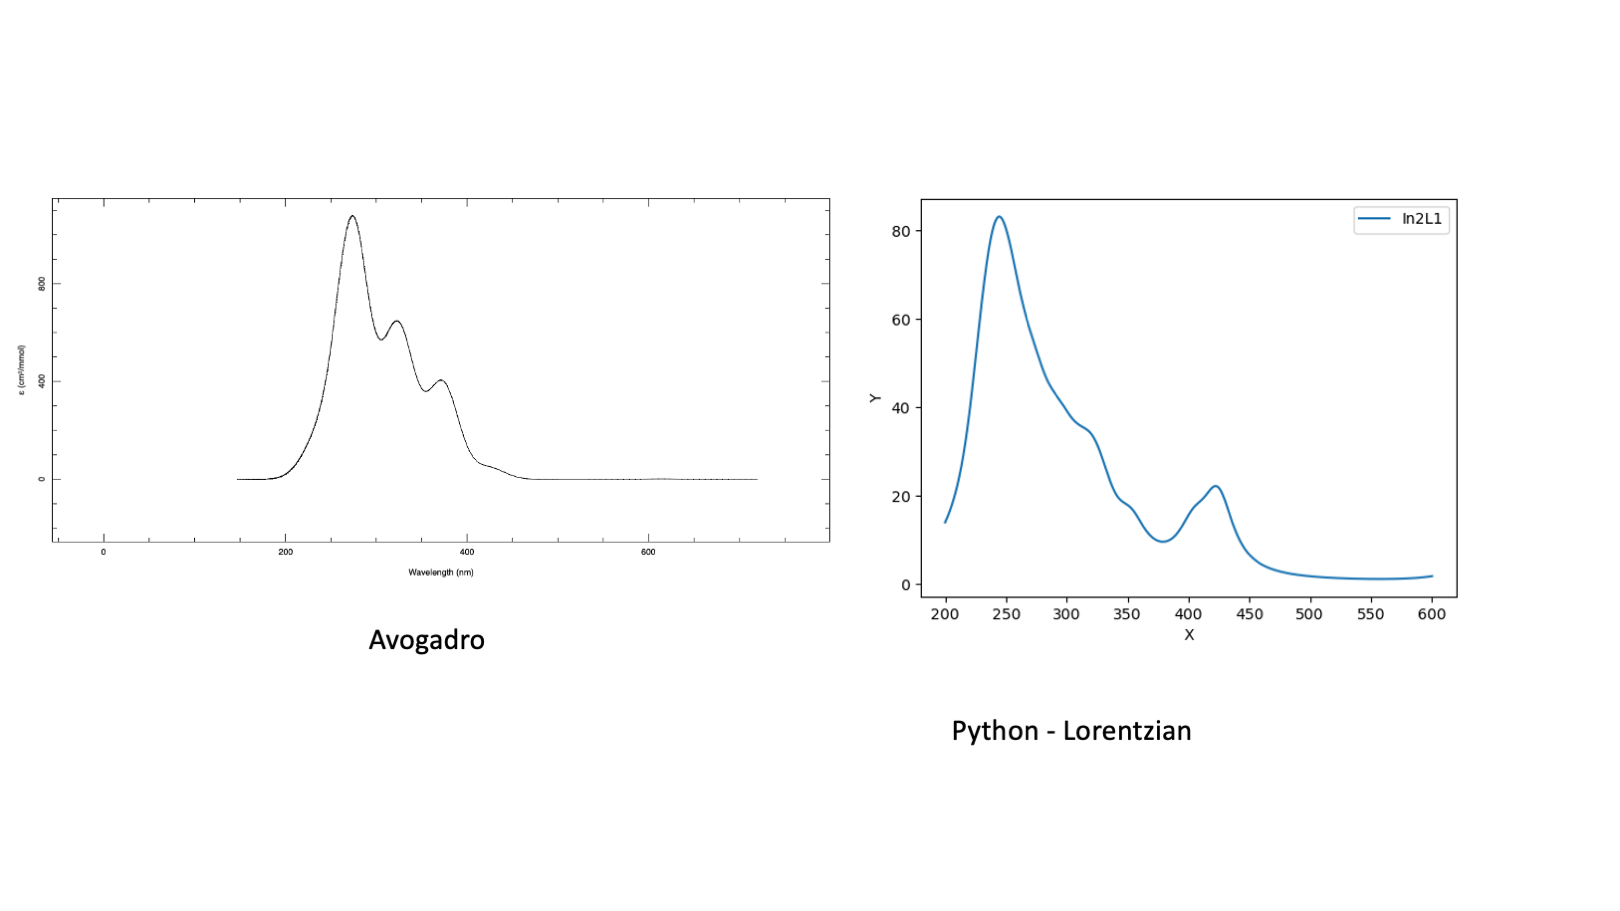
I am working with Avogadro 1.2. I tried gaussian and lorentzian functions. Below the Avogadro
which looks good and the python using Lorentzian.
I was wondering whether Avogadro includes some broadening due to external factors such as Doppler Broadening.
I would like just to know exactly how Avogadro makes the broadening.
At the moment, for UV/Vis electronic spectra Avogadro just applies a Gaussian broadening of a specified FWHM (converting that to a \sigma for the Gaussian), using the oscillator strengths as the intensity of the original peaks.
I don’t have a screenshot for UV/Vis spectra, but I recently posted an example IR with the stick spectra indicated Feature Wishlist for a Spectra Dialog - #5 by ghutchis
There can be a few reasons for different types of broadening in spectra, but at the moment, we’re mainly aiming for the “looks closer to experiment because of various broadening effects”
Does that help?
Thank you for the information. I could basically reproduce the spectrum obtained from the Avogadro, using the Gaussian broadening together with the doppler broadening.