Avogadro version:Release (1.100.0)
Operating system and version:Windows11
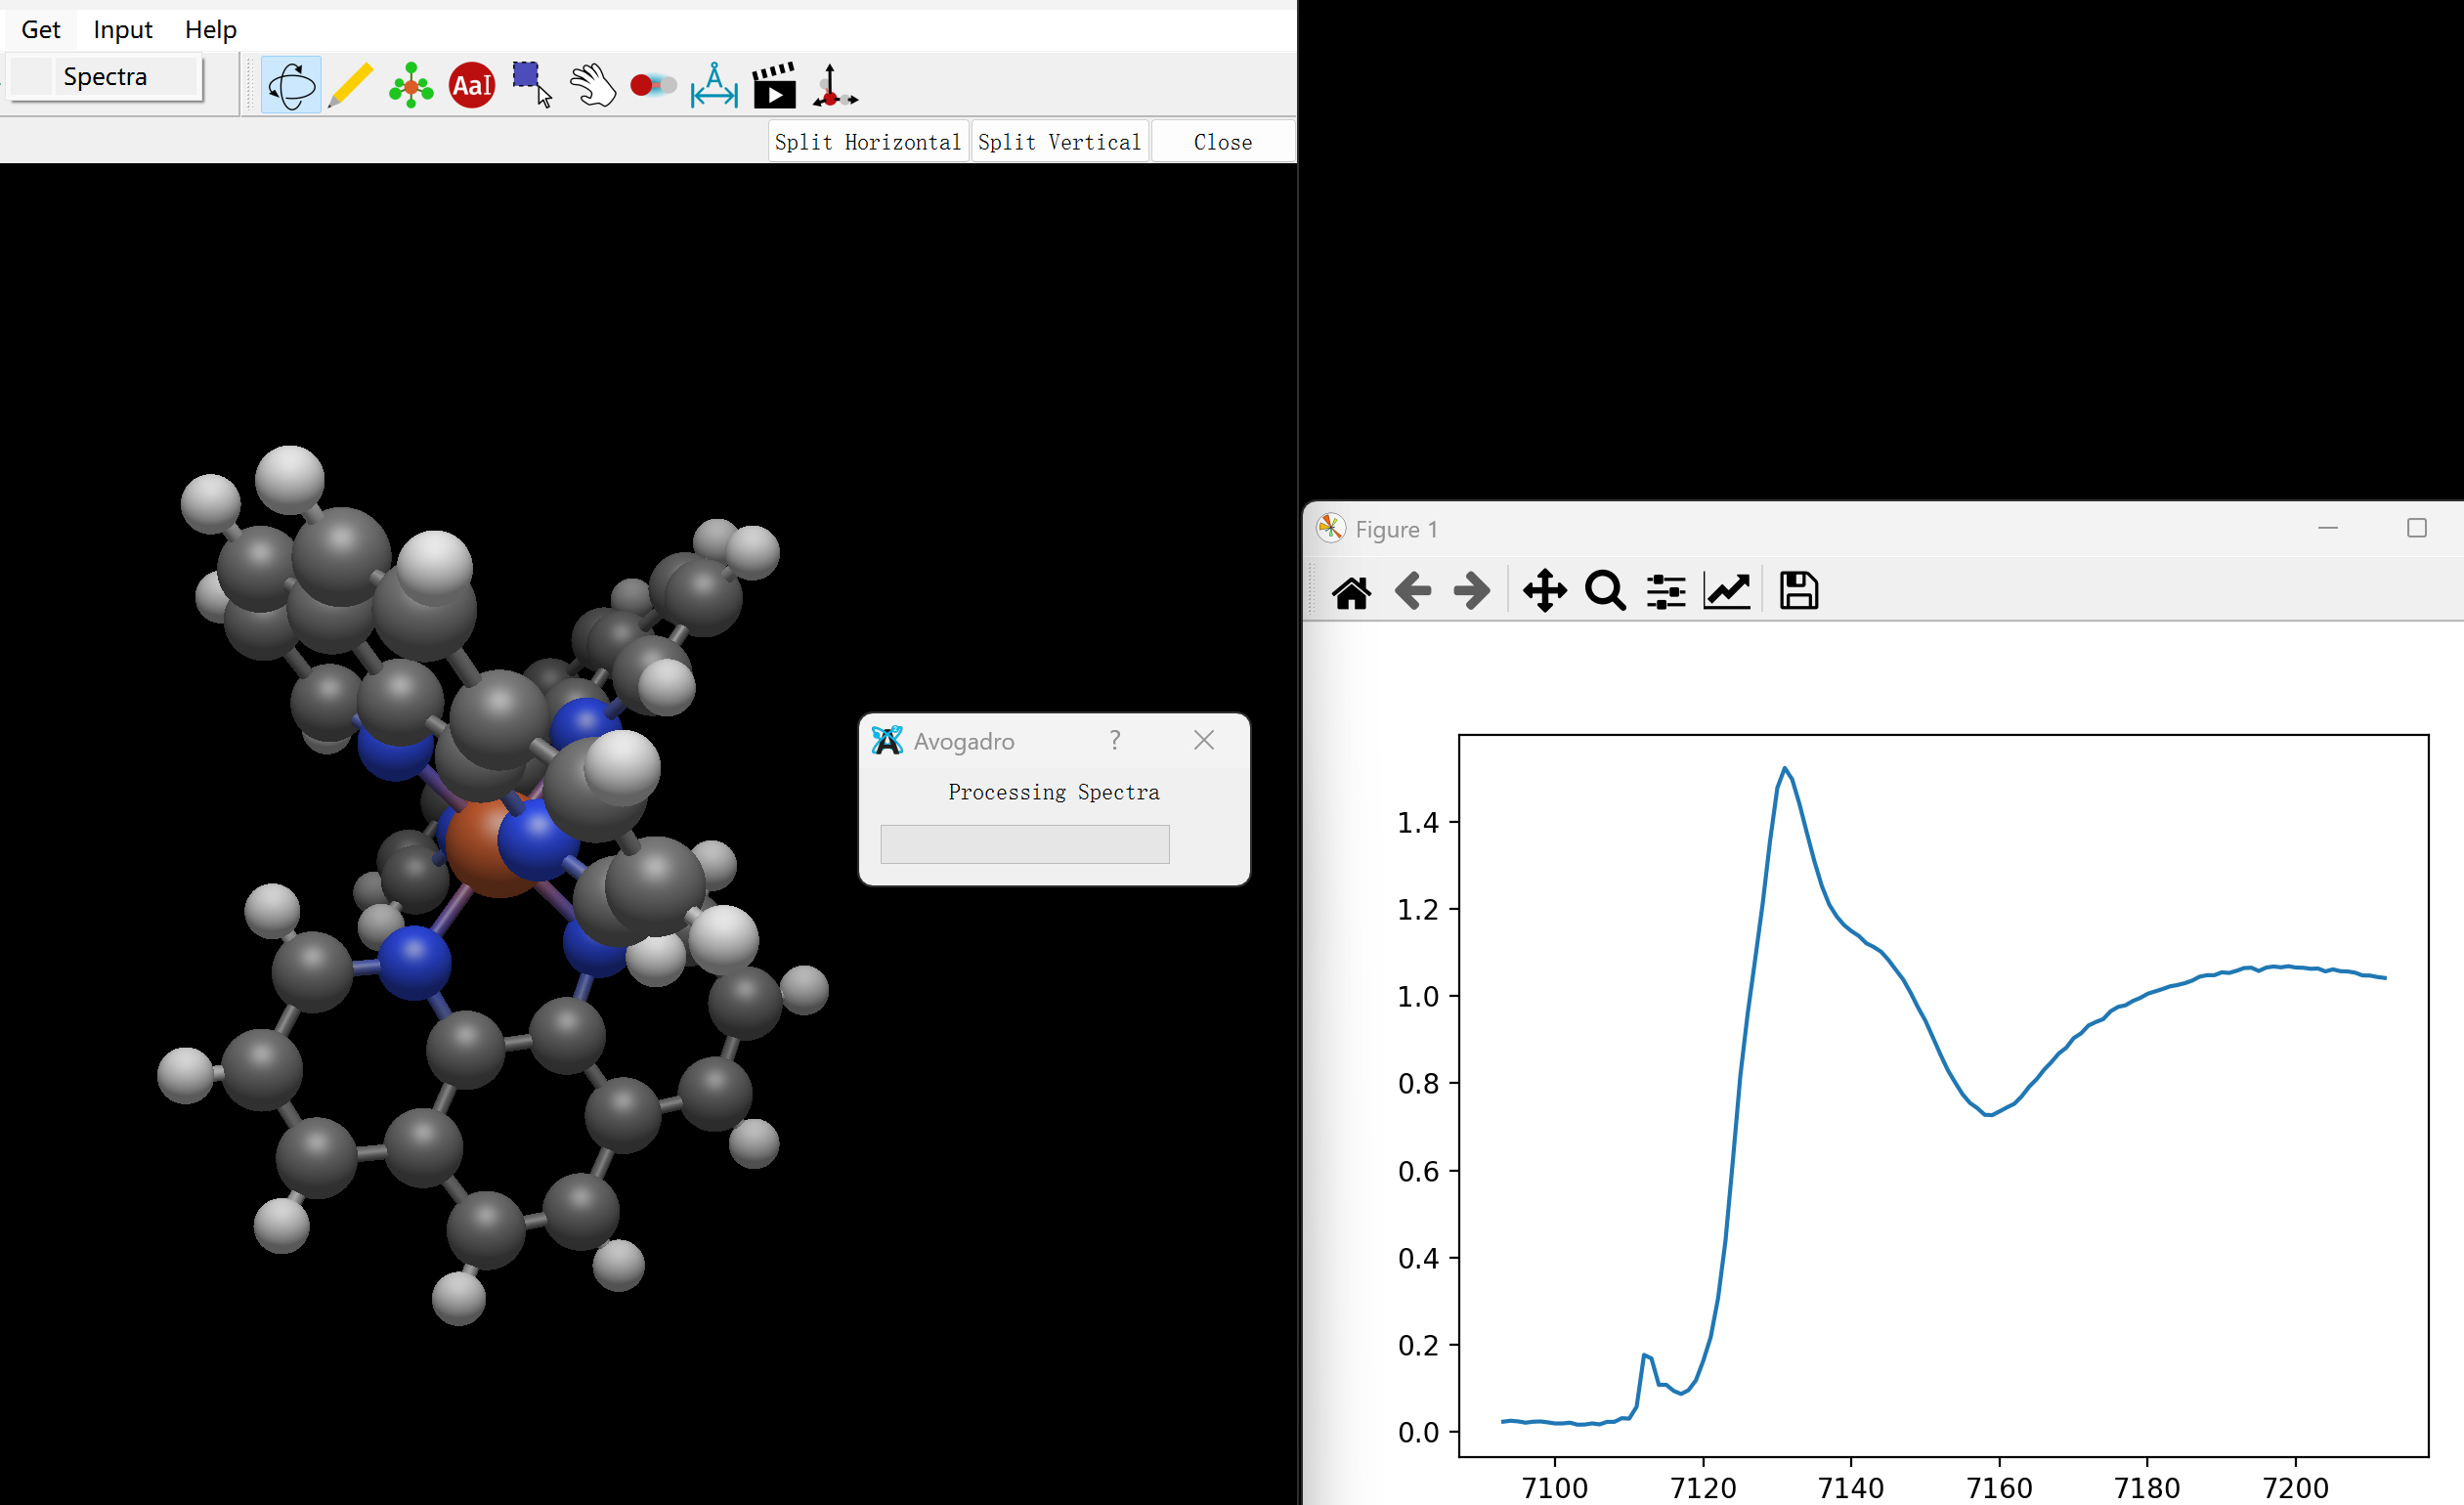
I’m trying to write a plugin (type:command) for drawing diagrams, and when clicking on a button in the menu bar, a ‘Processing…’ window before it displays the diagram drawn using python.
I calculated that runCommand() takes about 3s, but from clicking the button to drawing the diagram is about 10s in total.
I would like to know why the ‘Processing…’ Window, and what the time is consumed in, as well as is there a way to speed it up?
The processing window pops up as soon as the process has been running for a couple of seconds and remains in place until the process is finished. So I’d say it’s almost certainly whatever your Python code is doing that is taking the long time to run.
If you like you could try installing and running some of the other plugins to see if they are also slow to run. I can tell you for instance that running an optimization on water with the xtb plugin should be essentially instant. If that or some other simple plugin also takes multiple seconds to complete a command then it’d be worth investigating the root cause.
I suppose it’s possible that on your system there’s some significant overhead, but I think it’s more likely to be your code. How are you processing your data before plotting it with matplotlib?
And on another side, I’d like to formalize mechanisms to pass spectra information back to Avogadro directly. (That way it can be saved with the CJSON file automatically, etc.(
I wrote this plugin to take advantage of Avogadro’s 3D display: after the user pulls on an atom and changes the molecular structure, I convert the acquired Cjson to an xyz file and pass it into the trained model to predict the spectrum and display it.
I found that part of the time consuming is the “import torch” time, so I opened a new thread to pass the xyz file into the neural network model for prediction, which reduces part of the time overhead, and reduces the time from 10s to 6s.
I think this is a great way for me to save the spectral information with a CJSON file. Also, it would be better to show the obtained spectral information in a drawing at the same time.
The core requirement of the plugin development is to realize the real-time generation of calculation spectrum after atom dragging operation. In order to realize this interactive process, we hope to explore the method of dynamically capturing the CJSON data structure of the current scene from the script and transferring it to the calculation module by triggering an event with a single button. Is there a good way to do this?
You can save yourself that step by including "inputMoleculeFormat": "xyz" in the JSON object you print when the --print-options flag is used, see here.
Yes, well, PyTorch is a significant and complicated dependency so it is no surprise that the import time is long.
Anecdotally I also find that rendering a chart with matplotlib and displaying it is usually not instantaneous, but I doubt that’s your main bottleneck.
Out of interest, what are you actually trying to show with an interactive, instantaneous spectrum of a specific geometry of a static molecule? The utility isn’t immediately obvious to me.
In any case, I don’t think what you are looking to do is realistically implementable.
The Python process that is started by Avogadro is not persistent between calls – it is started when the command menu entry is clicked and is expected to end after returning its output on stdout. Every further call to the command is a new, isolated process, effectively the same as running the script on the command line repeatedly. This means that you can’t really keep anything going on the Python side while waiting for updates.
It also means that anything your script does is done every single time the command runs, so if you have to spin up a whole neural network to run on a GPU each time I can’t imagine that the total execution time will ever be fast (fast here meaning no human-perceptible latency i.e. <100 ms).
Additionally, the plugin infrastructure is not set up to enable scripts that should be called repeatedly, except in the case of force fields (“energy” scripts). Maybe @ghutchis would like to change this in the future, but for now it’s not possible.
That’s not to say that this kind of thing would be impossible to do, it’s just not possible using the current infrastructure and would require some hacking on your part to make something happen that’s not really meant to happen.
For full transparency, these developers reached out via e-mail a while ago with this particular concept.
The current plugin API is designed for use a menu item to trigger a command / script.
There’s a proposal for a “properties” plugin type which would be periodically polled as the molecule changes (e.g., think about a dipole moment or pKa prediction model, etc.)
At the moment, I haven’t considered leaving that particular process open asynchronously. I can see that use case, but I think it merits some discussion before actually implementing.
Personally, if you want to reduce the latency, I’d probably suggest using torchscript and having a compiled non-Python binary. Beyond the time required for import torch I’ve noticed that importing the model / torch.compile takes a significant latency hit in many of the ML-based force fields / potentials.
We’re starting a process to re-structure the plugin system around pixi which would potentially include just calling binaries or non-python programs.
On the other side, I’m curious about what kind of spectra your plotting. Right now, you should be able to pass back a set of IR peaks, etc. in the CJSON. But it looks like your model is applying broadening already, and the x-axis looks a bit unusual.