Right now, we’ve used VTK for a few things.
- One has been with the volumetric rendering, but hopefully we can merge @perminder-17 code in soon.
- The other has been with charts / graphs
I’m getting a bit annoyed with VTK breaking builds - right now, Windows isn’t compiling because of some VTK plugin that requires a particular feature of zlib and on my Mac, I’m getting weird errors when I mix VTK and Qt6.
Because of licensing conflicts, we can’t use Qt’s charting capabilities sadly. (It’s GPLv3 only.)
I’m inclined to switch out the VTK graphs for JKQTPlotter: JKQTPlotter - A Qt Plotting Library - it’s licensed under LGPL v2.1, and offers some nice features including the use of LaTeX formatting for text (e.g., cm^{-1} or \lambda) and built-in save-to-graphics, save-to-spreadsheet, etc.
Any reasons I shouldn’t drop VTK?
1 Like
It’s possible you’ve already looked into them, but KDE Frameworks also have a couple of options that might be worth looking at: KQuickCharts (Qt Quick) and KPlotting (Qt Widgets).
I imagine they are solidly maintained, they’re tested and bug-fixed for the latest releases of Qt6 (whereas the JKQTPlotter home page says tested up to 6.3), they’re both LGPL, and neither have any dependencies other than Qt.
Doubt they’re as feature-rich, though.
Yeah, I looked a few years ago, when VTK was previously broken (before Marcus migrated our code to VTK-9) .. KPlotting is really simple. I also looked at a few cases with JavaScript graph libraries in Qt Quick - KQuickCharts looks better maintained than most of those.
But it would be nice to have more than just simple line / scatter plots (e.g., boxplots, violin plots, histograms, contour plots, etc…)
I’ve tested JKQTPlotter on 6.9 and it works great. I think it’s mostly one guy. I’ll see if I can pull together some code to see what’s needed to switch.
1 Like
Okay, I have some progress on my laptop. I’m going to put jkqtplotter into the openchemistry repository as a submodule like VTK.
Good news, on my Mac, the VTK libraries weigh in at 140MB and these are like 24MB, so a nice win.
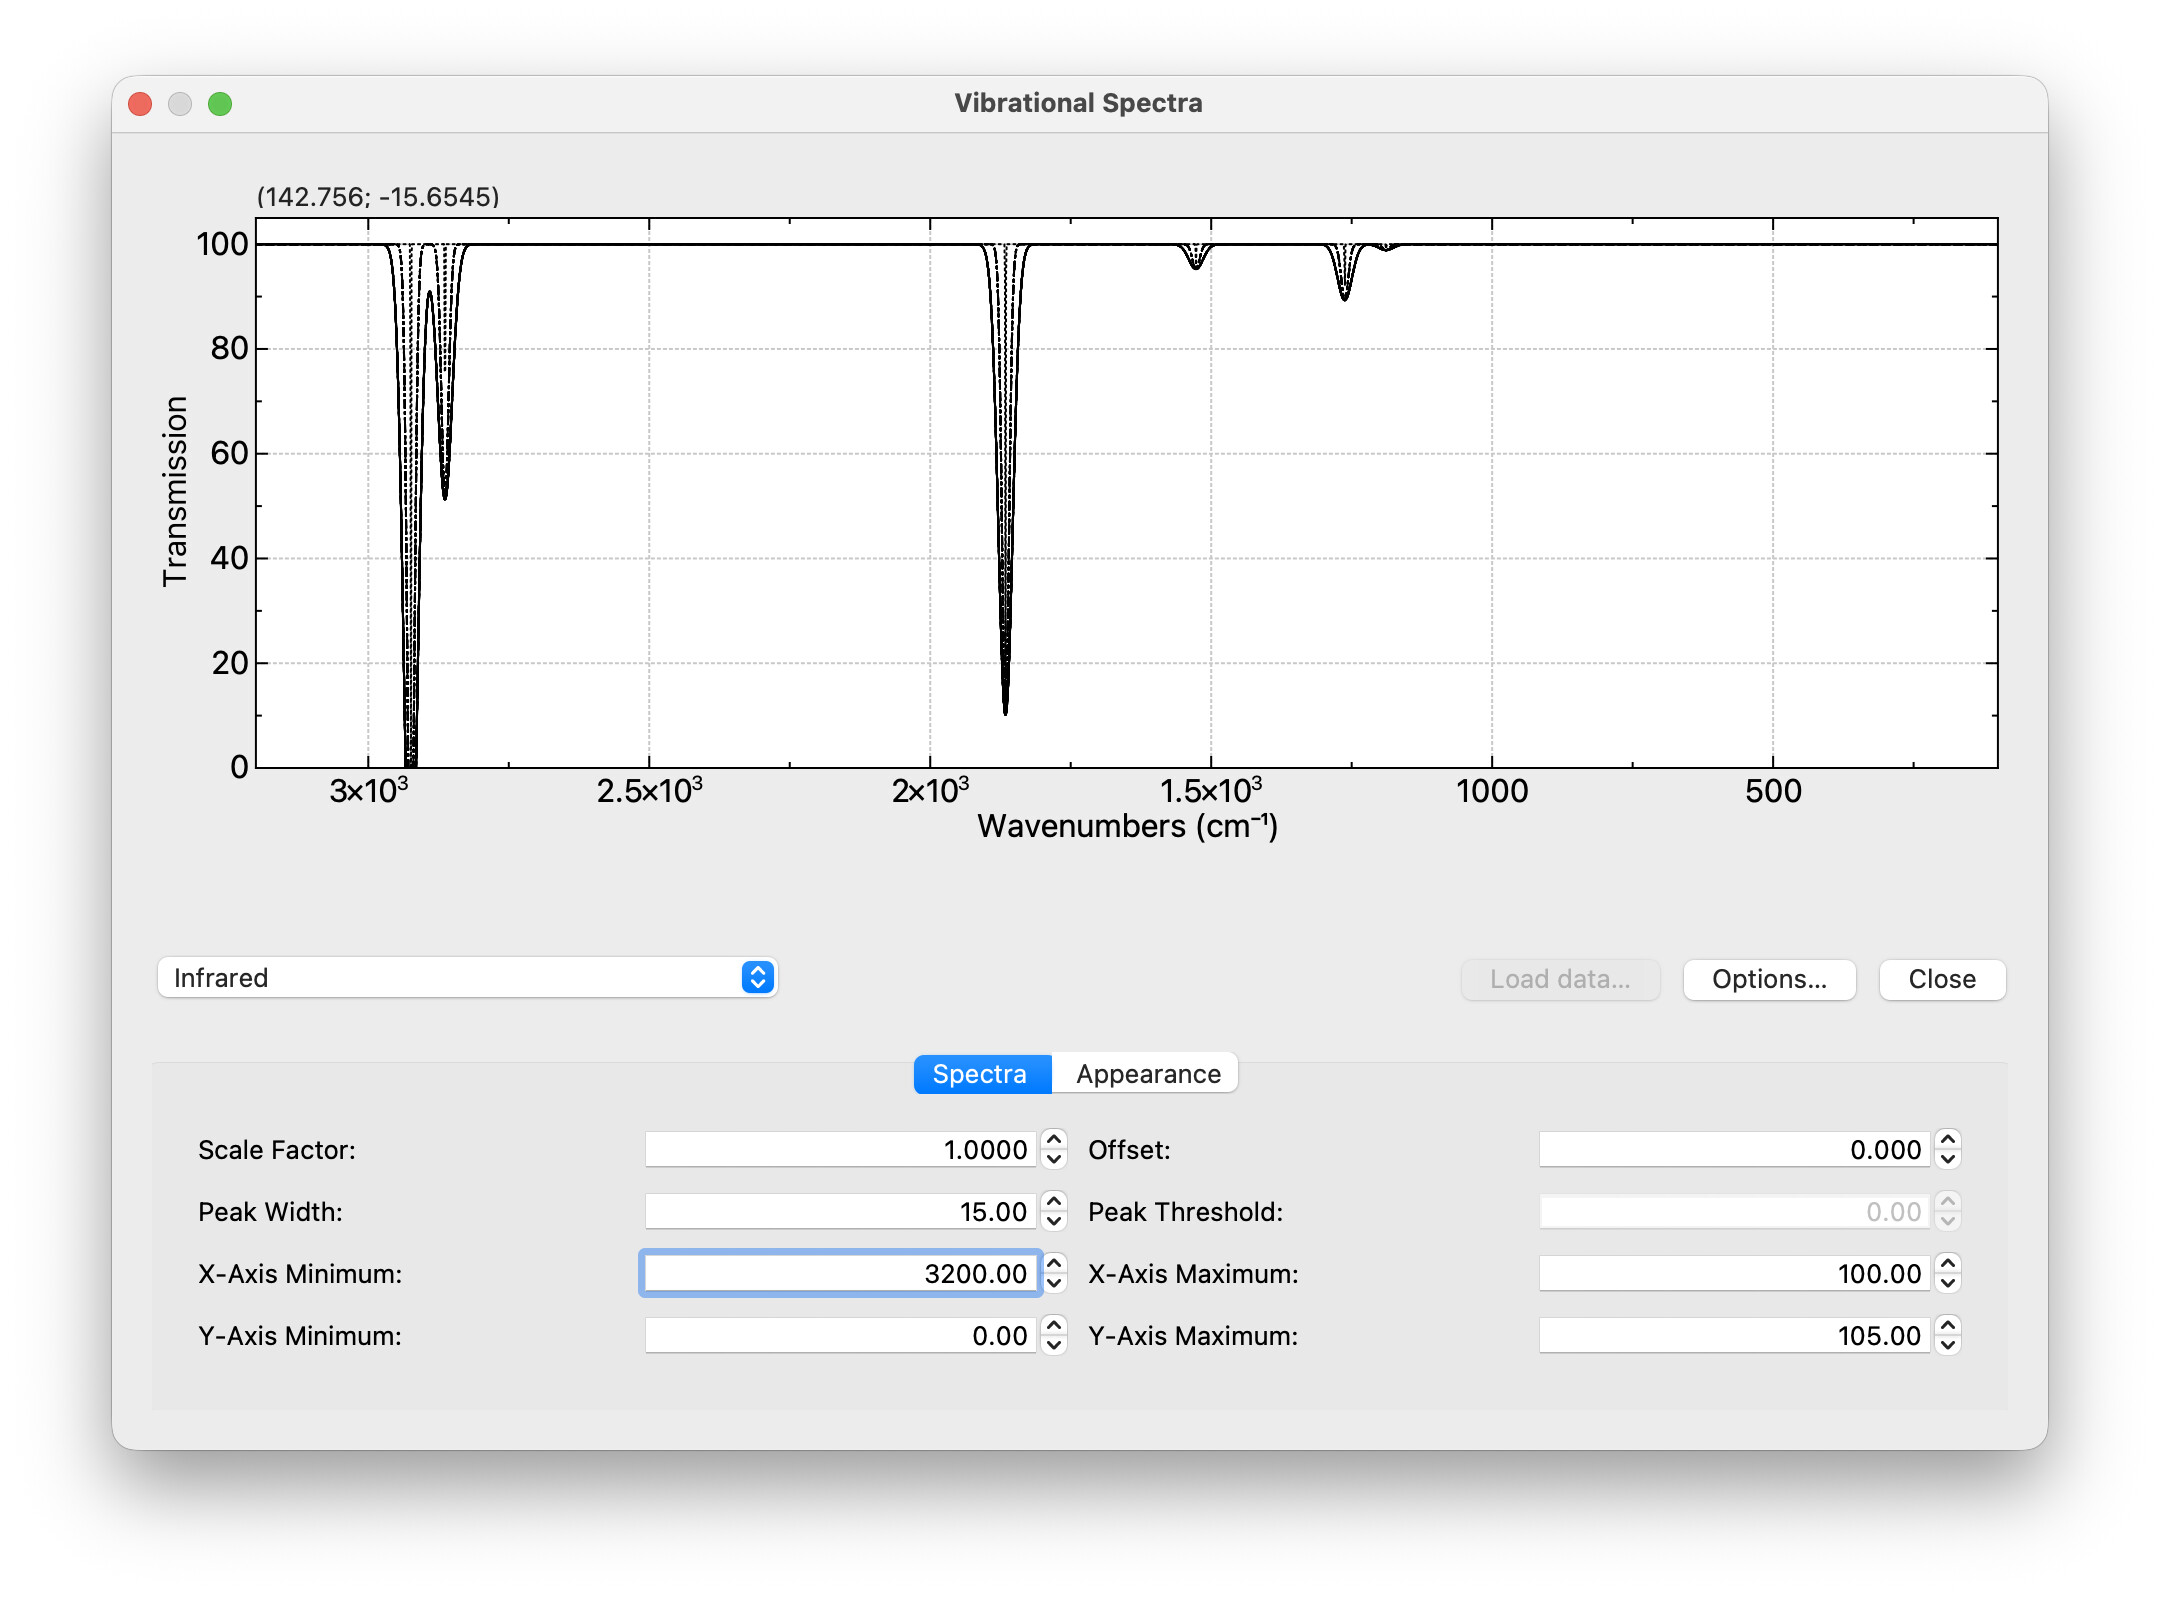
I’ve started porting the Spectra dialog:
It’s much easier to enable / disable multiple plots (e.g., raw stick spectra, smoothed, experiment), color them differently, etc. It should also be easier now to switch plot units since I can create calculated columns (e.g., wavenumbers to Hz, wavelength to eV, etc.)
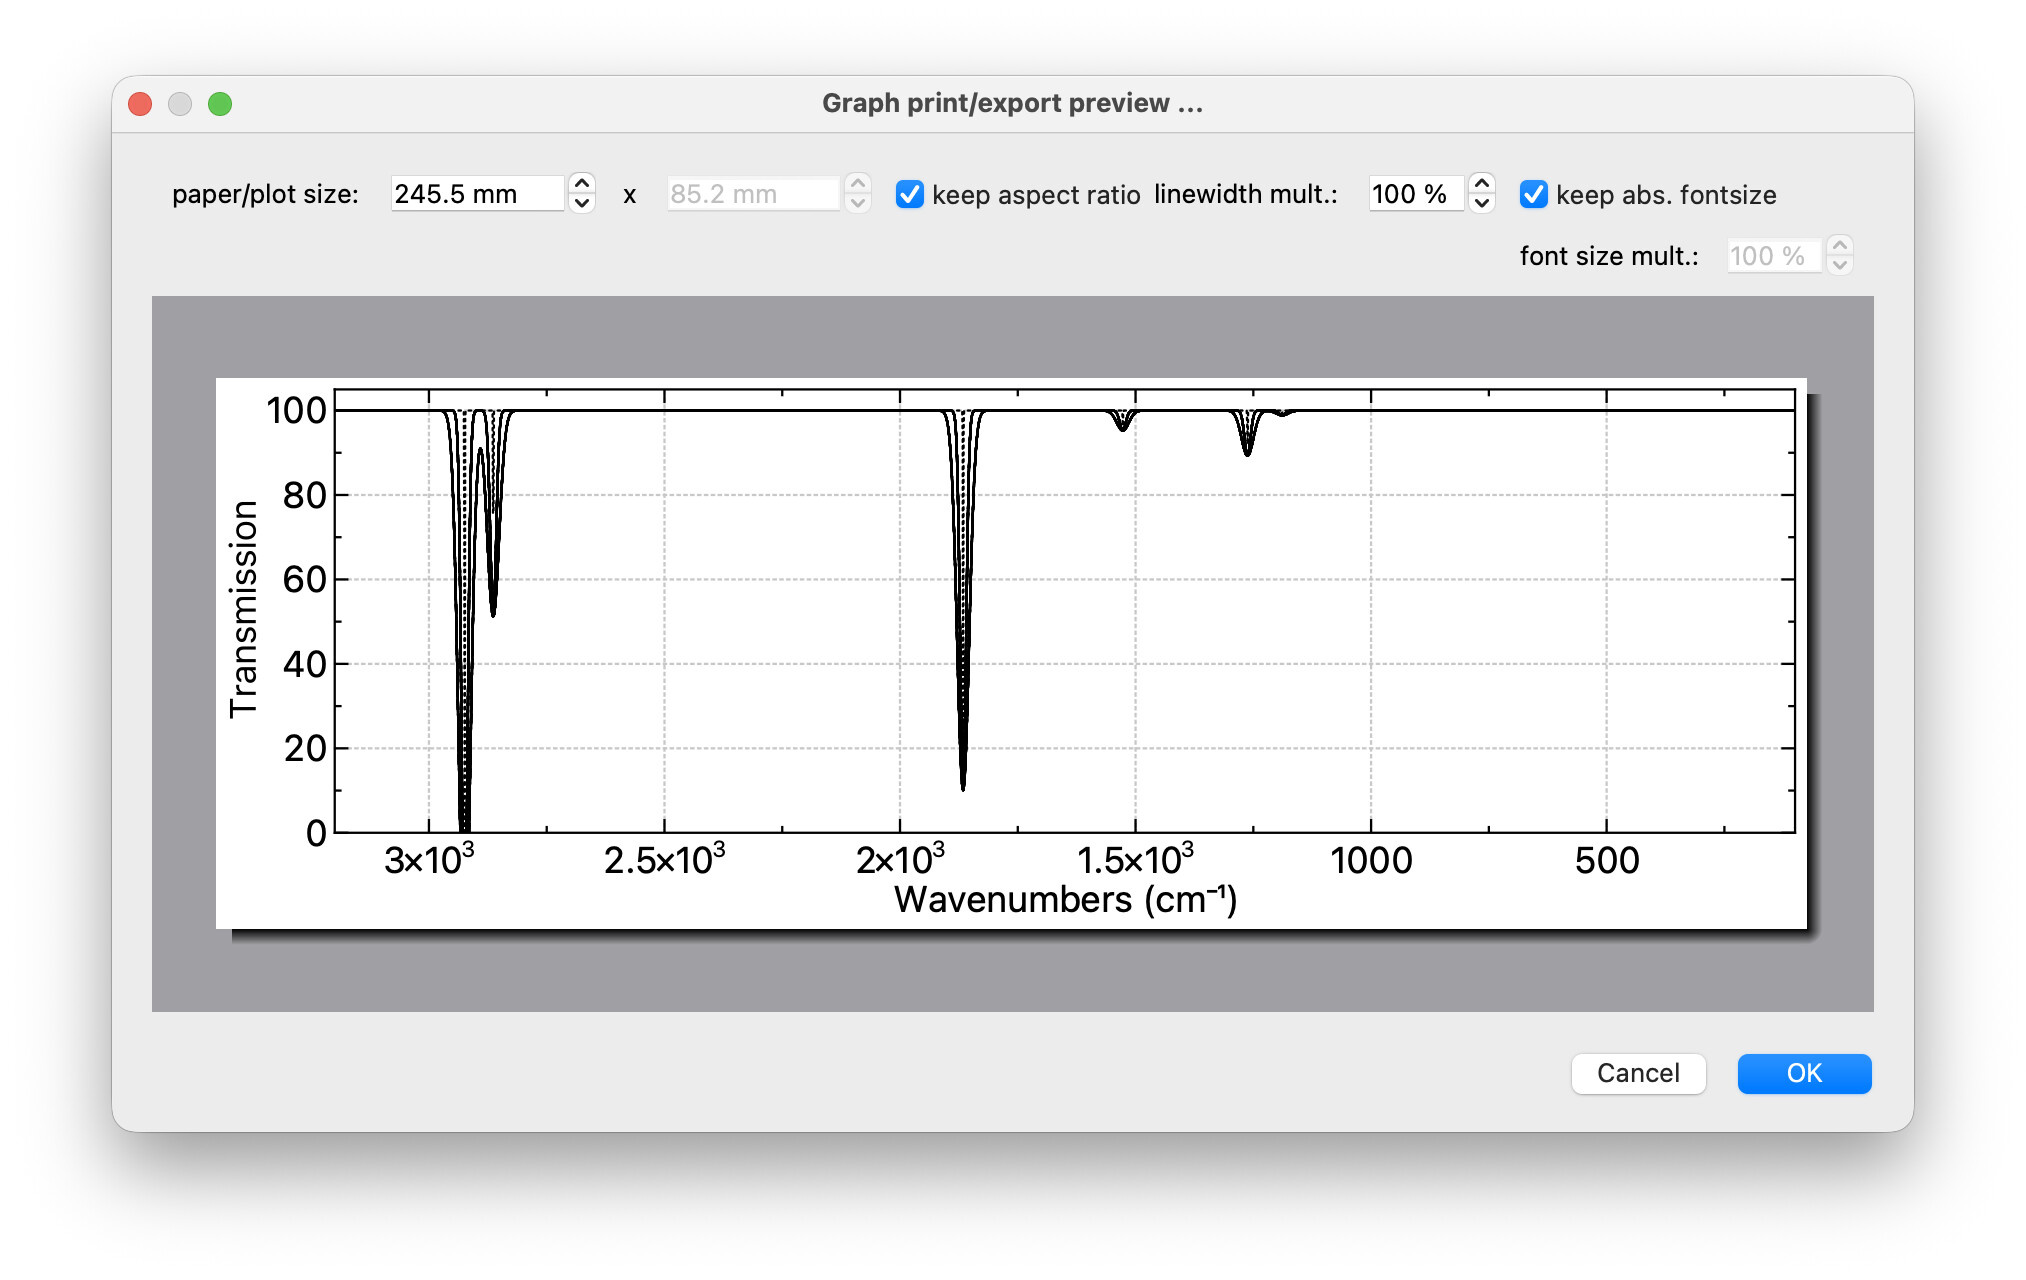
As a bonus, there’s a little toolbar (automatically) to save the underlying data as CSV, TSV, etc. the graph as PDF, SVG, PNG, etc.
And yes, it’s actually a high-quality PDF to throw into a presentation, publication..
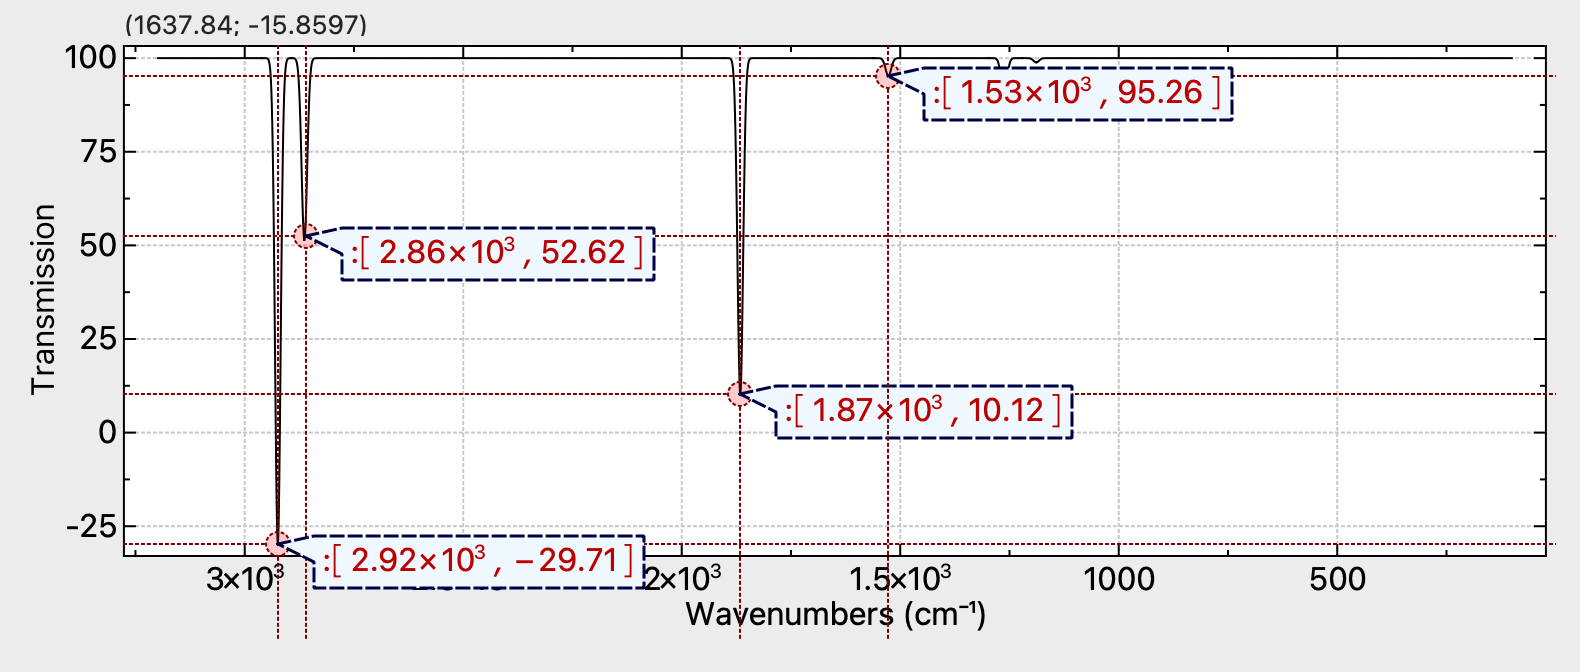
I also have some code to add peak labels. I think it’s an easy win even if it’s not a common Linux package (yet).
1 Like
Actually as it turns out, there’s already a manual peak-pick tool, although it doesn’t add it to the exported spectra (yet):