Avogadro version: 1.2.0
Operating system and version: Mac OS Sonoma 14.2.1
Expected Behavior
I want the electrostatic potential map to look like the first photo in the Dropbox, with the red indicating more electron density and the blue indicating less.
Actual Behavior
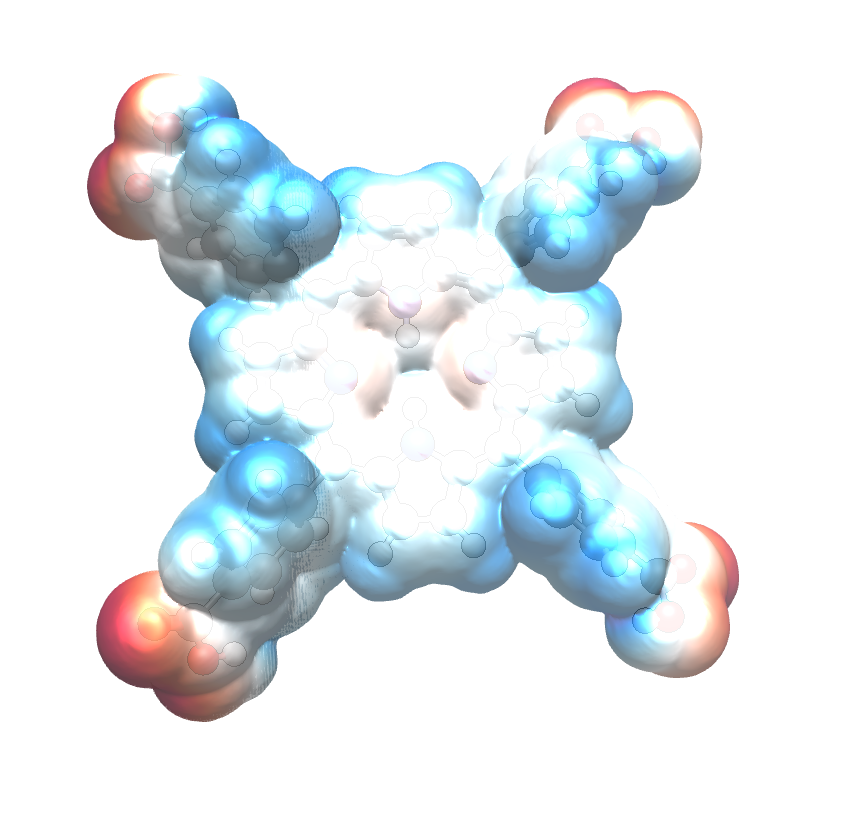
However, when I try the electrostatic potential map I end up with the other photo where it is just all one color.
Steps to Reproduce
I start with my structure then go to “extensions”, “create surfaces”, surface type: “van der waals”, color by: “electrostatic potential”, and iso type: “0”.
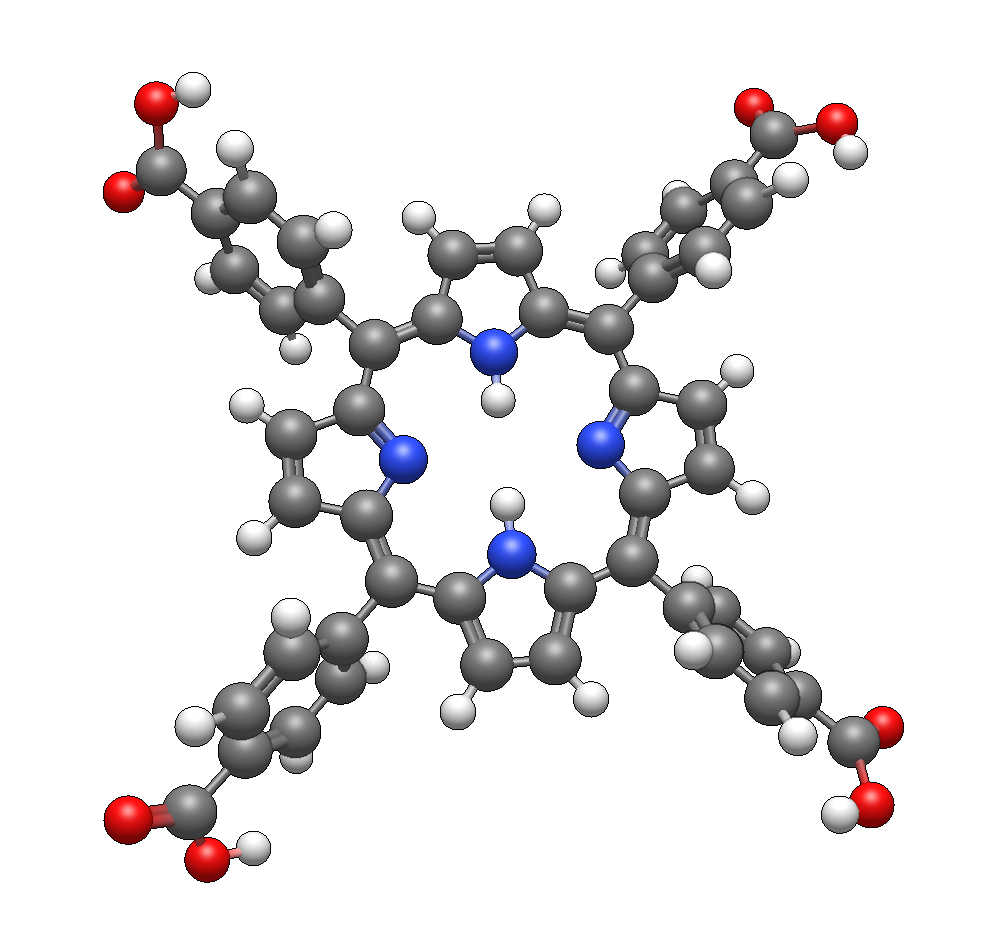
(i.e., a substituted porphyrin with benzoic acid substituents) … but your graphic shows four oxygens with extra hydrogens, e.g. \ce{C(=O)OH2+} which seems highly unusual.
For example, version 1.98 shows this electrostatic potential for the protonated form I have above:
I am also not sure what I am looking for in the electrostatic potential map but it would seem like there should be some areas of more electron density.
The electrostatic potential map is a reflection of positive and negative partial charge across the molecule. (It’s the difference between the electron density and the positive charge of the protons in each atom.)
For a neutral molecule, there will likely be some regions of more positive and more negative charge.
The first molecule you posted had four “extra” hydrogens on the oxygens. (The molecule structure you just linked had neutral \ce{CO2H} groups off each “arm.”
So the first molecule has a total molecular charge of +4 … so there’s a lot less electron density than a neutral molecule and you’ll see positive charges.
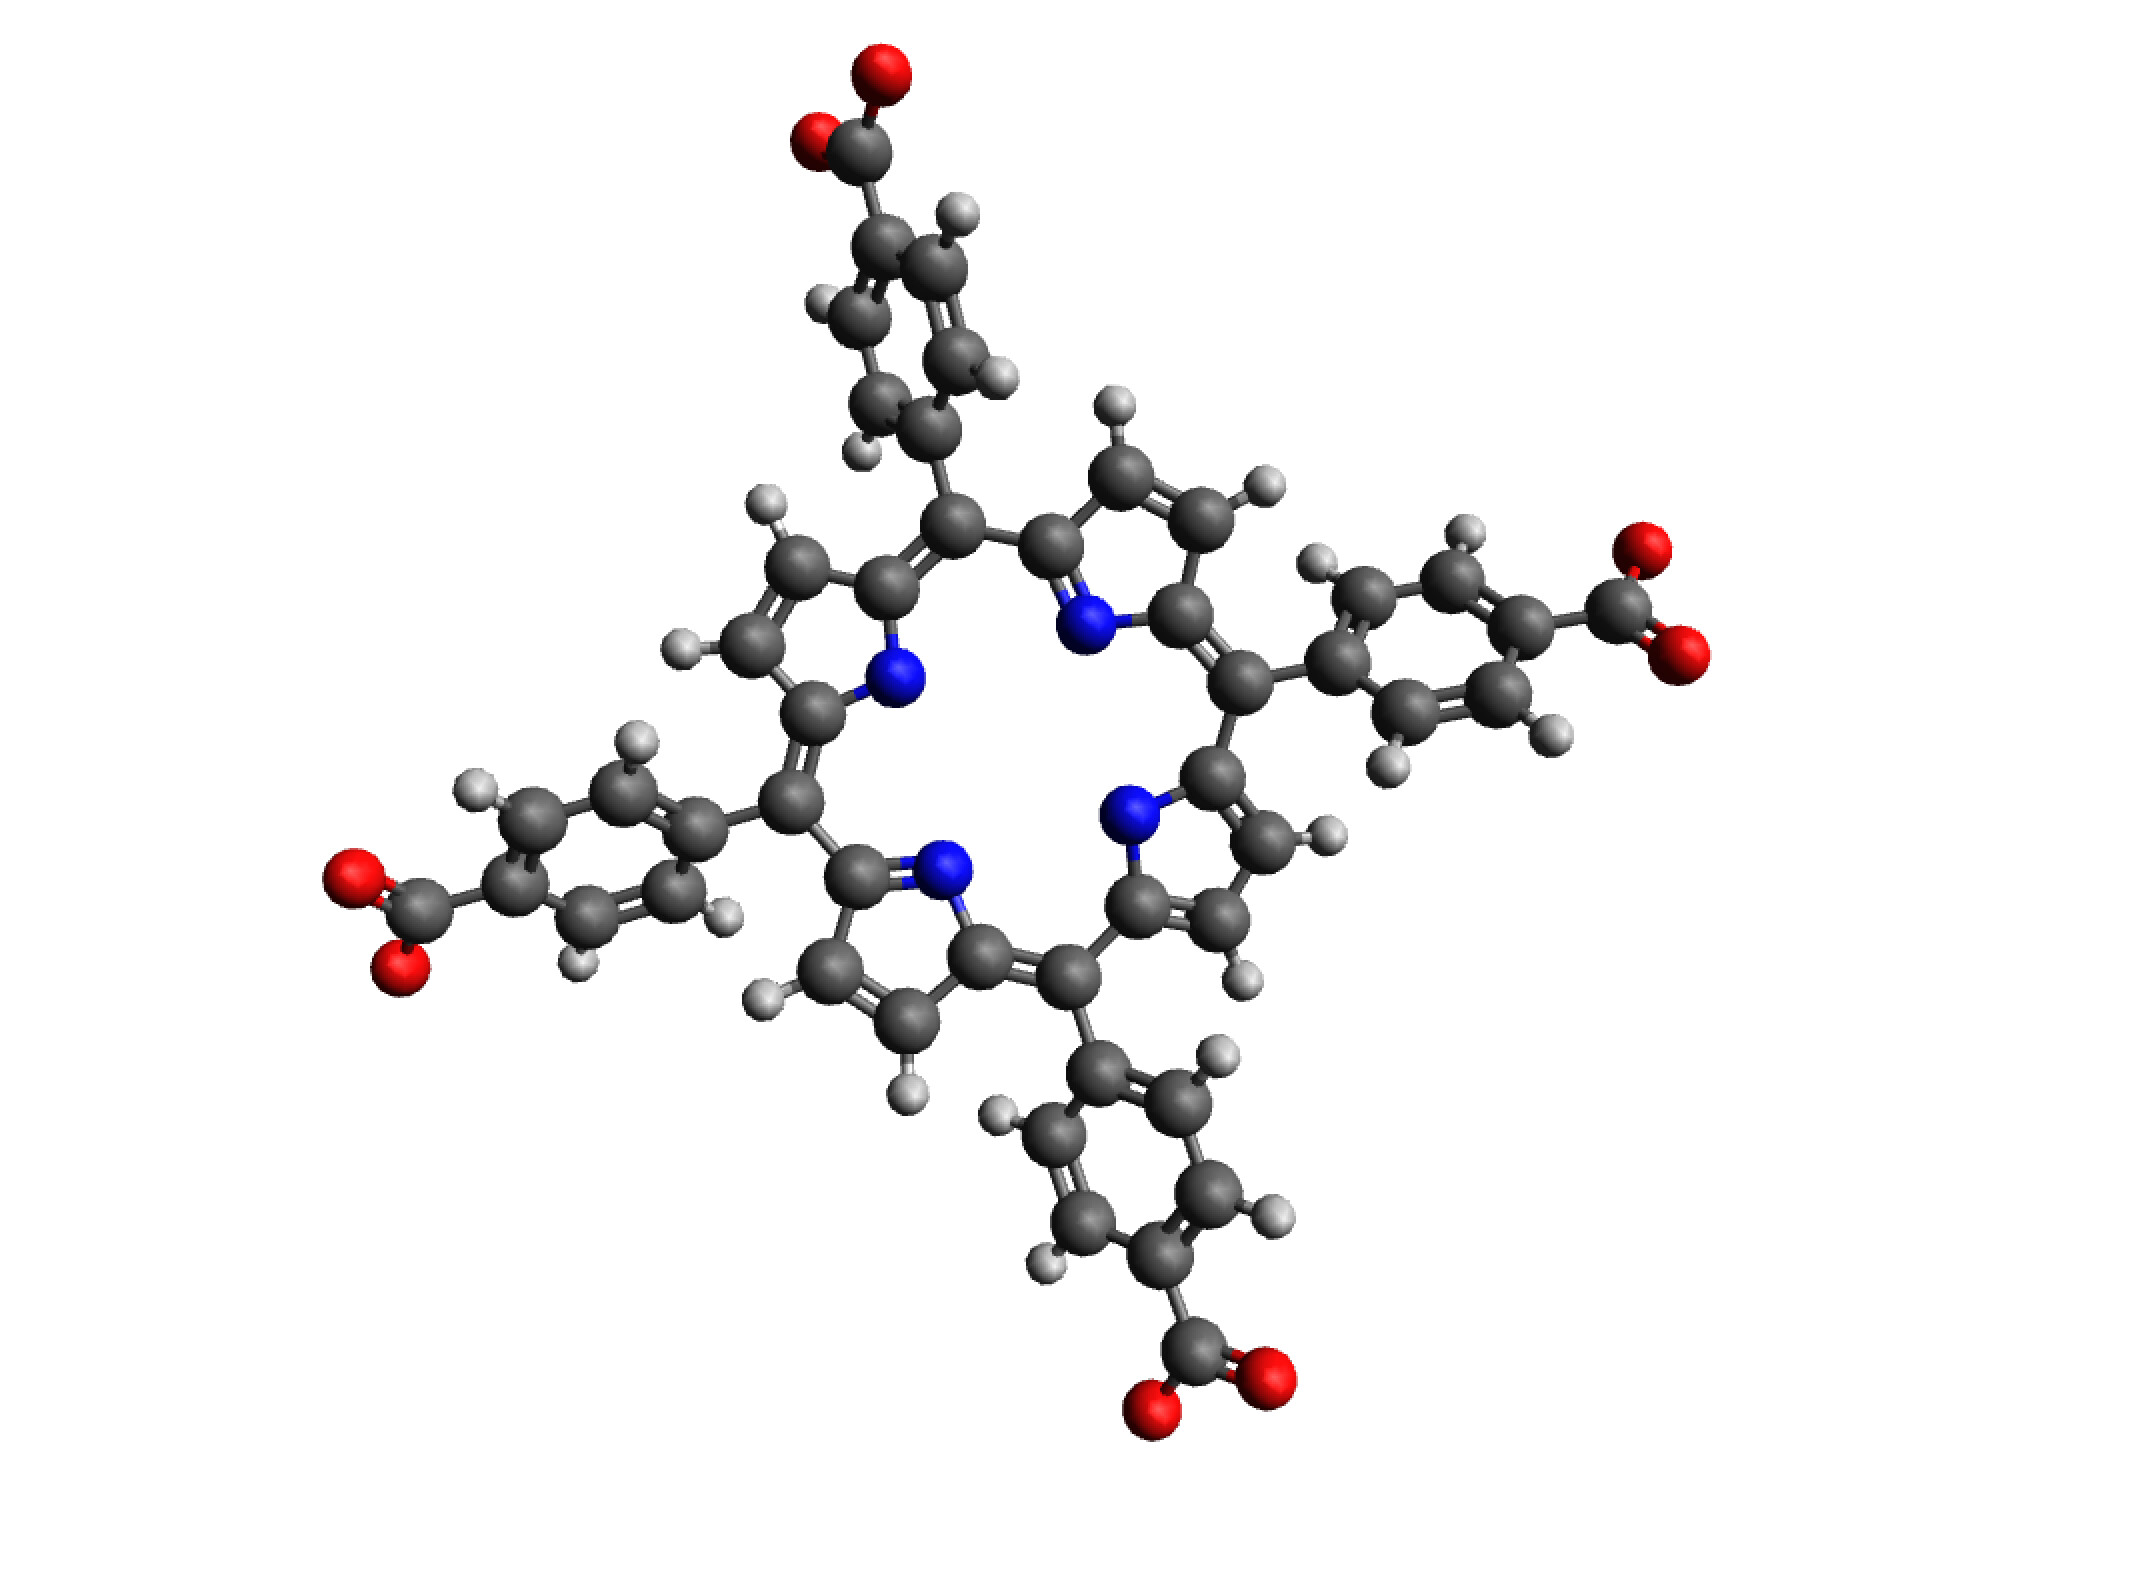
The molecule image you just posted has no hydrogens on those oxygens, so each has negative charge and a -4 overall molecular charge. There will be a lot more electron density and probably everything is red.
But neither looks to be “right” based on the molecular structure you say is your target. That has neutral molecular charge (as in the images I posted) and some regions of positive charge (e.g., H atoms) and some regions of negative charge (around the oxygen atoms).
Now in solution, some of those carboxylic acids will probably deprotonate, but I doubt it will be all four of them.