Hi,
On Tue, May 19, 2009 at 08:27:57PM -0700, Jonas Baltrusaitis wrote:
I want to get back to my feature request of adding pwscf calculated
DOS plotting. Actually, what I meant was getting back to my favorite
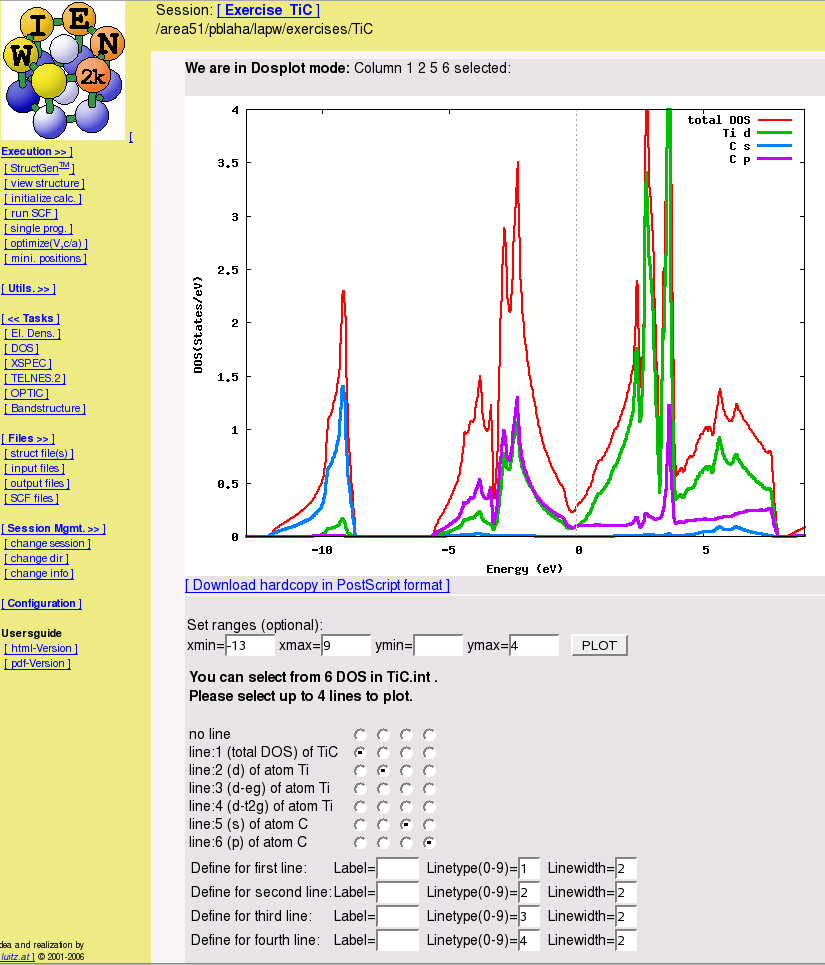
topic: data manager. As an exampled here
http://www.wien2k.at/features/img93.png can be seen.
I see a DOS plot here, not a data manager. I think it is agreed upon
that plotting the DOS is a desired feature. If wien2k has a good data
manager, can you describe it and/or post screenshots of it, please?
The truth is that lots of software packages calculate lots of data but
manipulating it is really challenging.
What do you mean with manipulating? Do you want to modify some values
of your DOS calculation to make it look different? Do you want to
modify some input values (like geometry) of your system and have the DOS
recomputed?
I mentioned that before and I’ll say again: creating a data manager
that can not only plot IR spectra, but plot various calculated
properties from the file. This would avoid adding one by one (IR,NMR)
but instead would recognize various data and allow plot them, instead
of asking David implement one or another. Once a layout is created for
it, formats can be added as needed
I think it does not make sense to plot arbitrary data, e.g. plotting the
dipole moment would be pretty pointless I guess?
Having a generic some-energy-scale-vs-some-intensity-scale plot for
various data would be nice though. But I guess it would already break
down for e.g. orbital energy vs. occupation number.
As an example, I have bunch of files calculated with pwscf and I need
to sum up selected files and plot them (DOS). I can’t find anything
automated, everything would be semi manual. I am sure more people
would find that functionality useful
OK, so now I probably understand a bit better what you meant by
“manipulating” above, you want to merge/blend data from different
sources for your plot?
Maybe this could be achieved through some Avogadro extension. Maybe it
makes more sense to do this as an external OpenBabel-based application
and then use Avogadro to render the results, not sure. In any case I
think this is rather an advanced use-case compared to general-purpose
plotting.
Michael