I recently downloaded Avogadro and wanted to visualise some frequencies by loading in the output file of my calculation in ORCA 5.0.4. What I saw in tutorials suggested that just dragging and dropping the file in the viewport will automatically open up a panel with the frequencies selectable. But all it does for me is to show me the molecule from my job.
This is all I see:
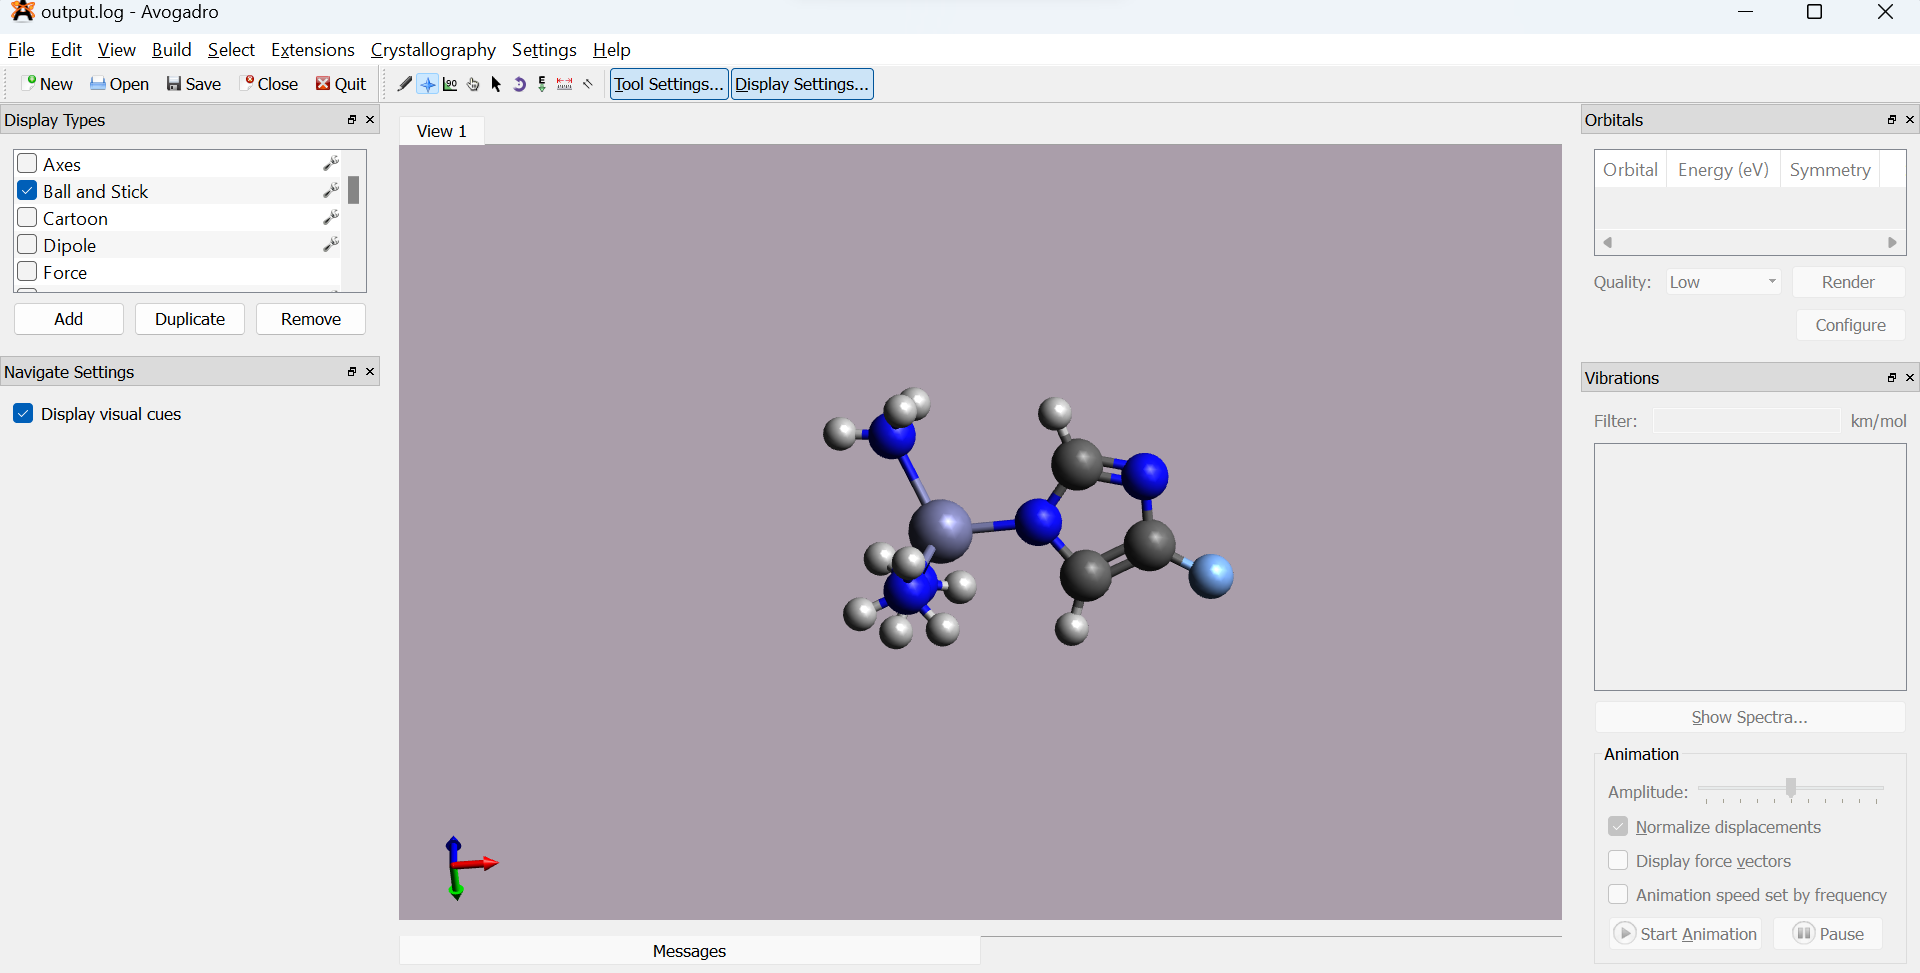
I’ve turned on the toolbar for vibrations manually and the one for orbitals but I don’t see anything that isn’t greyed out.
There are definitely vibrational frequencies in the outfile. I even used LARGEPRINT in the ORCA input.
-----------------------
VIBRATIONAL FREQUENCIES
-----------------------

Scaling factor for frequencies =  1.000000000  (already applied!)

   0:         0.00 cm**-1
   1:         0.00 cm**-1
   2:         0.00 cm**-1
   3:         0.00 cm**-1
   4:         0.00 cm**-1
   5:         0.00 cm**-1
   6:        12.10 cm**-1
   7:        18.79 cm**-1
   8:        32.78 cm**-1
   9:        43.02 cm**-1
  10:        58.65 cm**-1
  11:        71.30 cm**-1
  12:       101.48 cm**-1
Environment Information
Avogadro version: 1.2.0
Lib: 1.2.0
Obabel: 2.3.90
Qt: 4.8.6
Operating system and version: Windows 11
Files: avoadro freqs