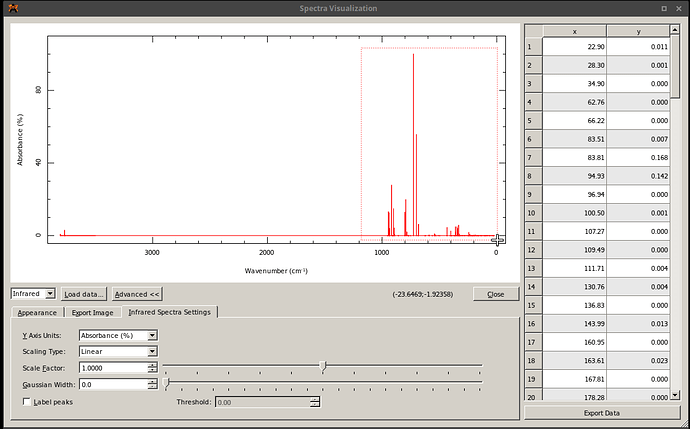
I am using the MacOS version (v1.2) and would like to independently adjust the x,y-axes of an IR absorption spectrum. I have only been able to zoom in/out using the mouse but both axes are zoomed simultaneously. Ideally I would like to specify the wavenumber range and then either adjust the absorbance scale or have it automatically scale with respect to the displayed spectral region.
Is that possible?
It’s been a while since I’ve used the spectra on v1.2… I though I remembered Advanced settings that let you do that, but I don’t see them. (I didn’t code that feature.)
My suggestion would be to Export the spectra (click the Advanced Settings and you’ll see an “export data” button appear below the table). You can then use whatever graph / plot program you want. The export should include the scaling factor (e.g., multiply all vibrational frequencies by 0.97) and any Gaussian broadening.
Thanks, ghutchis. Unfortunately the “export” function only saves line positions and intensities (aka, a stick spectrum). I can certainly do something in Mathematica but was hoping to save myself the effort.
I think it is possible to do something similar to what you want. I was able to zoom the region of the spectrum by pressing the mouse wheel and dragging a rectangle at the needed area:
Thanks, but it looks like you are on Windows. I could not invoke a selection rectangle on the MacOS version. I tried all manner of key modifiers with left- and right-click to no avail.
Yes, sort of – it is a Win version under Wine in Ubuntu. I could not make native Avogadro 1.2 work… Unfortunately, I cannot tell anything about Mac.
